Housatonic River Watershed Basin Stream Flow Data
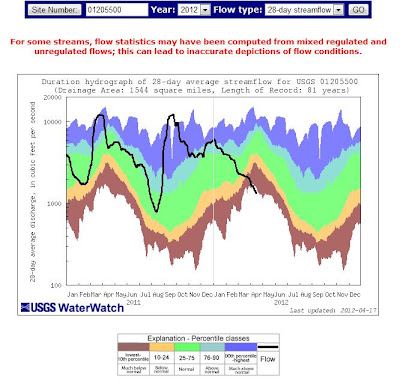
The Bantam River and it's associated tributaries stream flows have been quite low lately. I found some data at the USGS WaterWatch that helped me explore the current stream flows. The Housatonic River Watershed Basin stream flow that incorporates the Bantam and Shepaug Rivers is monitored at the Stevenson Dam, located along the town lines of Oxford and Monroe, CT. The above graph shows stream flow from January 1, 2011 to April 15, 2012 as a bold black line. The other colored regions show you the 28 day average level of much above normal water levels (dark blue), above normal (light blue), normal (green), below normal (orange), and much below normal (brown). Normal seasonal stream flow is high in spring, while it is low in winter and summer. Notice that autumn stream flow is normally low but it has a wide range, therefore it can be high in certain years and not be unexpected. For example, the stream flow rate in autumn 2011 was very high because of Hurricane Irene and because we had lots of rain throughout the season. Now look at our current stream flows! It is below the much below normal flow rates and it is the spring season! I think this is a pretty interesting pattern, but I am not sure what this means for the living organisms that rely on this vital resource (water). We are currently living in an obvious drought. Therefore, we all must conserve the water that we have in our homes and yards. Use this tool to investigate your watershed and examine it's current stream flow at various ranges.
Subscribe to:
Post Comments (Atom)


No comments:
Post a Comment